How SVG Doughnut Charts Work — A Trigonometric Approach
The elegant intersection of math and code: building doughnut charts with animation

In this post, I want to talk about something I recently wrestled with: drawing doughnut charts with SVG. Drawing the chart itself is straightforward since SVG provides a circle element, but what really gave me trouble was the animation.
Of course, you can easily get a doughnut chart by using a chart library like chartjs or nivo, but all I actually needed was a bar chart and a doughnut chart. Using a full chart library felt like overkill, and I figured I could just throw something together with canvas or SVG — so I decided to build it myself.
How It Started

// The original interface looked like this
<DoughnutChart size={40} rate={80} />
It all started with this doughnut chart. It was only being used in one specific service I was responsible for, so it had a rather naive interface. But recently, other teams started needing it too, which meant I had to make the interface more abstract.
The original interface rendered a single data point onto an empty doughnut using a rate percentage value, so it only worked under the assumption that there would always be exactly one data point.
But to make the doughnut chart freely usable across different contexts, I needed to support visualizing multiple data points — which meant overhauling both the chart logic and the animation.
Drawing a Doughnut Chart
Drawing an SVG doughnut chart itself is fairly simple by combining the circle element with stroke. Let’s start by drawing a simple circle in SVG.
<svg width="500" height="500" viewBox="0 0 100 100">
  <circle cx="50" cy="50" r="20" fill="transparent" stroke="blue" stroke-width="10" />
</svg>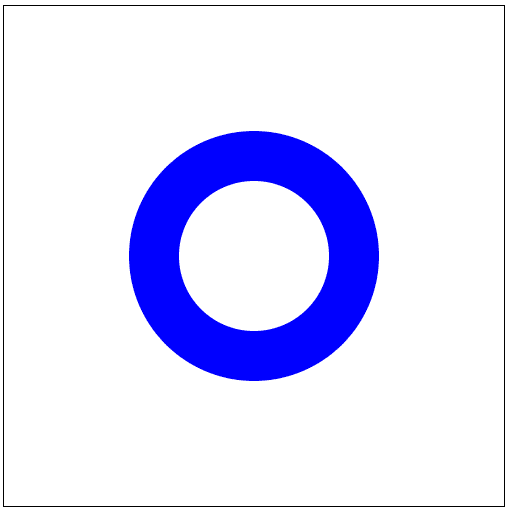
In SVG, numbers without explicit units are implicitly defined in px. I rendered a square box with width and height of 500px and used viewBox="0 0 100 100" to define an internal coordinate system of 100px by 100px.
Without the viewBox attribute, SVG would automatically render a viewbox matching the width and height pixel values, but having coordinates from 0 to 100 makes it easier to reason about shape positions.
So the box we see is 500px on each side, but internally it operates on a 100 × 100 coordinate system. I then rendered a circle centered at (50px, 50px) with a radius of 20px and a stroke width of 10px.
This circle by itself can be thought of as a doughnut chart where a single data point takes up 100%. Since SVG’s circle element alone can produce the basic shape, the visualization itself isn’t particularly difficult.
But a doughnut chart should be able to visualize multiple data points simultaneously. So how do we represent multiple data points?
Visualizing Multiple Data Points
A doughnut chart is essentially a single doughnut shape divided among multiple data points. In other words, each data point occupies a portion of the circle.
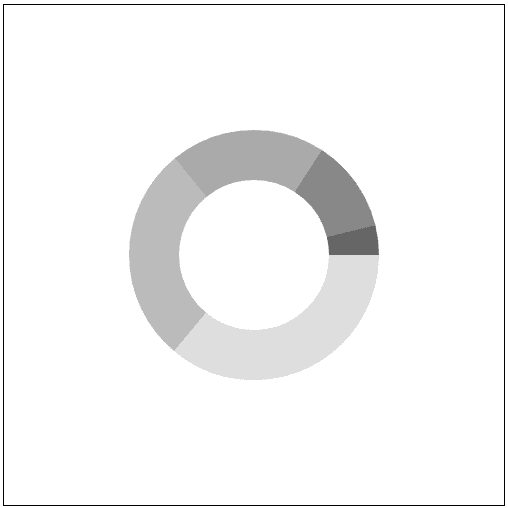 Each data point occupies a portion of the circle
Fortunately, SVG provides a stroke-dasharray attribute that can render dashed lines (dashes), which is exactly what we need to control how much of each data point to draw.
<circle
  cx="50"
  cy="50"
  r="20"
  fill="transparent"
  stroke="blue"
  stroke-width="2"
  stroke-dasharray="10 5"
/>
stroke-dasharray takes a series of space-separated values to define the dash pattern: the first value determines how long to draw the line, and the second determines how long to leave a gap. So the code above draws 10px of line followed by 5px of gap, repeating around the circle:
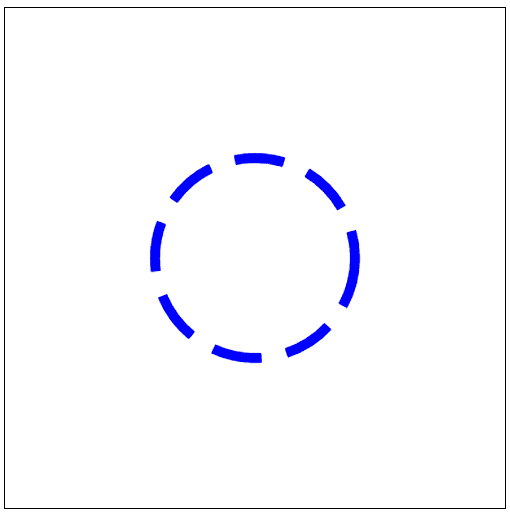 A dashed line with 10px dashes and 5px gaps
Using this attribute, we can draw a line that occupies only part of the circle while leaving the rest as a gap — which is how we represent multiple data points in a doughnut chart.
But if you look closely at the example above, the line segment on the right side of the circle is longer than the others. That’s because the values I passed to stroke-dasharray don’t evenly divide the circumference.
stroke-dasharray takes values in px — the length of lines and gaps. So to get evenly spaced dashes, you need to first calculate the circumference and then use values that divide it evenly.
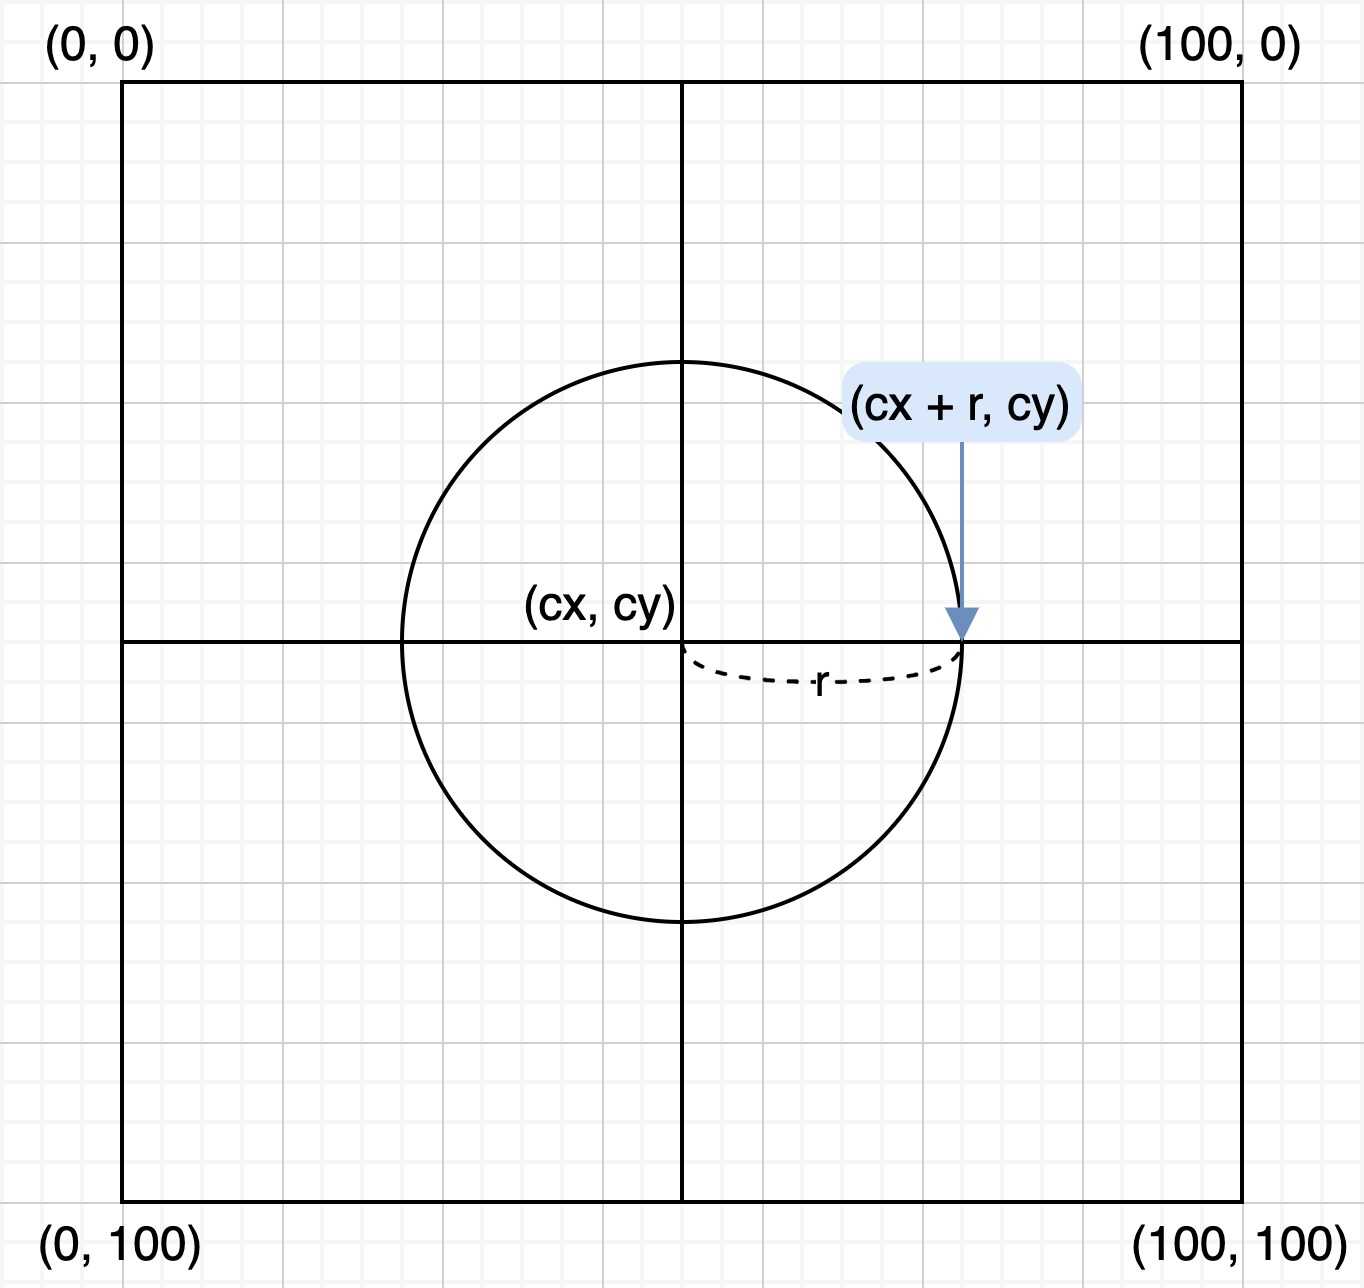
SVG renders circles starting from the point (cx + r, cy) — the rightmost point of the circle. So if stroke-dasharray doesn’t align precisely with the circumference, you get that uneven segment at the starting point.
The formula for circumference is the beautifully simple , which we can easily compute with Math.PI:
const radius = 20;
const diameter = 2 * Math.PI * radius;
console.log(diameter); // 125.66370614359172
With a radius of 20px, the circumference is about 126px. Dividing by 15 (the sum of our dasharray values, 10 + 5) gives 8.37 — not a clean division. So the dash pattern repeats 8 times with 0.37 worth of leftover awkwardly attached to the start.
To properly visualize multiple data points in a doughnut chart, you need two pieces of information:
- The circumference ()
- The ratio of each data point to the total
const radius = 20;
const diameter = 2 * Math.PI * radius;

const dataset = [9, 5, 4, 3, 1];
const total = dataset.reduce((r, v) => r + v, 0);

dataset.forEach(data => {
  const ratio = data / total;
  const strokeLength = diameter * ratio;
  const spaceLength = diameter - strokeLength;
  console.log(`stroke-dasharray = ${strokeLength} ${spaceLength}`);
});
stroke-dasharray = 51.4078797860148 74.25582635757692
stroke-dasharray = 28.559933214452663 97.10377292913907
stroke-dasharray = 22.847946571562133 102.81575957202959
stroke-dasharray = 17.135959928671596 108.52774621492013
stroke-dasharray = 5.711986642890533 119.95171950070119With the circumference and each data point’s ratio, we can define exactly how much of the circle each data point should occupy.
But if you try to render the chart with just this information, you’ll hit a problem: every data point starts rendering from the same point, (cx + r, cy).
No matter how accurately you’ve computed the line lengths, if every data point renders from the same starting point, you end up with a sad-looking chart like this:
 An unidentifiable something has been summoned
Since a doughnut chart accumulates data to eventually form a complete circle, after rendering one data point, the next data point’s starting position needs to be offset by the total of all previously rendered data.
Fortunately, SVG provides the stroke-dashoffset attribute to shift where the dash pattern begins, so we just need to compute the right offset values.
const dataset = [9, 5, 4, 3, 1];

// Accumulate the data values
const acc = dataset.reduce((result, value) =>
  [...result, result[result.length - 1] + value],
  [0]
);

console.log(acc);[0, 9, 14, 18, 21, 22]The first data point doesn’t need any offset, so it starts at 0. The reduce function’s second argument is the initial value, so we pass an array containing just 0.
Since the initial array already contains 0, the accumulated array is one element longer than the dataset. The last element 22 — equal to the total — isn’t really needed since these values define starting positions for rendering, and 22 represents the point where all data has been rendered.
With these accumulated values, we can compute exactly how many pixels to offset using (acc[i] / total) * diameter:
const radius = 20;
const diameter = 2 * Math.PI * radius;

const dataset = [9, 5, 4, 3, 1];
const total = dataset.reduce((r, v) => r + v, 0);
const acc = dataset.reduce((result, value) =>
  [...result, result[result.length - 1] + value],
  [0]
);

dataset.forEach((data, i) => {
  const offset = (acc[i] / total) * diameter;
  console.log(`stroke-dashoffset = ${-offset}`);
});
stroke-dashoffset = 0
stroke-dashoffset = -51.4078797860148
stroke-dashoffset = -79.96781300046746
stroke-dashoffset = -102.8157595720296
stroke-dashoffset = -119.9517195007012You could skip reduce and just use a let variable that accumulates as you render. The key point is knowing “how far have I rendered so far.”
Notice I’m negating the offset values. That’s because SVG renders lines in the counterclockwise direction by default.
Intuitively, you’d expect doughnut chart data to accumulate clockwise, so SVG should render clockwise too — but SVG doesn’t care about your expectations. Data might accumulate clockwise in this chart, but depending on how coordinates are defined, counterclockwise is equally valid. Changing the rendering direction every time coordinates shift would be inefficient, so SVG always draws counterclockwise by default.
This same concept applies to arcs, which I’ll discuss below. Keeping this in mind will make it easier to understand how arcs are rendered. To verify SVG’s drawing direction, you can test with lines instead of circles:
<line stroke-dasharray="5" stroke-dashoffset="0" x1="10" x2="90" y1="10" y2="10" stroke="#000" />
<line stroke-dasharray="5" stroke-dashoffset="3" x1="10" x2="90" y1="20" y2="20" stroke="#000" />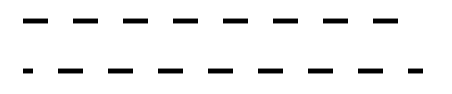 With an offset of 3, the bottom line shifts 3px to the left
<line stroke-dasharray="5" stroke-dashoffset="0" x1="10" x2="90" y1="10" y2="10" stroke="#000" />
<line stroke-dasharray="5" stroke-dashoffset="-3" x1="10" x2="90" y1="20" y2="20" stroke="#000" />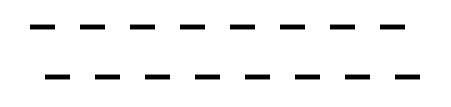 With an offset of -3, the bottom line shifts 3px to the right
Now that we understand all this, we can freely control how much data to render along the circumference and how many pixels to offset each data point’s starting position, using stroke-dasharray and stroke-dashoffset.
Full Code
<!-- Draw a 100 x 100 viewbox -->
<svg viewBox="0 0 100 100" id="svg"></svg>
const radius = 20; // Chart radius
const diameter = 2 * Math.PI * radius; // Chart circumferenceconst colors = ['#ddd', '#bbb', '#aaa', '#888', '#666'];
const dataset = [9, 7, 5, 3, 1];
// Total of all dataset values
const total = dataset.reduce((r, v) => r + v, 0);
// Accumulated dataset values
const acc = dataset.reduce((arr, v, i) => {
const last = arr[arr.length - 1];
return [...arr, last + v];
}, [0]);
// Time for some property-setting grunt work...
const svg = document.getElementById('svg');
dataset.forEach((data, i) => {
const ratio = data / total;
const fillSpace = diameter * ratio;
const emptySpace = diameter - fillSpace;
const offset = (acc[i] / total) * diameter;
const circle = document.createElementNS('http://www.w3.org/2000/svg', 'circle');
circle.setAttribute('cx', '50');
circle.setAttribute('cy', '50');
circle.setAttribute('r', String(radius));
circle.setAttribute('fill', 'transparent');
circle.setAttribute('stroke', colors[i]);
circle.setAttribute('stroke-width', '10');
circle.setAttribute('stroke-dasharray', `${fillSpace} ${emptySpace}`);
circle.setAttribute('stroke-dashoffset', String(-offset));
svg.appendChild(circle);
});Building Animation with Arcs
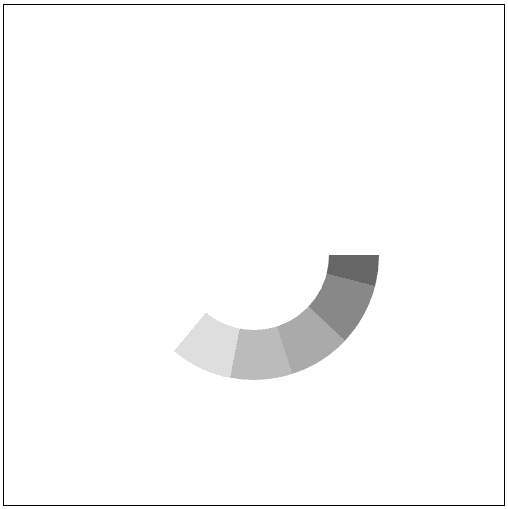
Now we can freely render beautiful doughnut charts with any dataset. But the real challenge wasn’t rendering the chart. Let’s look at my implementation again.
.
.
 Uh... there's a nice animation in there
There aren’t actually that many ways to implement this kind of animation. If you want to keep it lightweight, it comes down to roughly two approaches:
- Use SVG’s
clippathormask- Animate the
stroke-dasharrayandstroke-offsetproperties for each data point
This is a fairly settled debate. The second approach — animating stroke-dasharray and stroke-offset per data point — means defining separate animations for each slice of the doughnut chart.
But making the second data point’s animation start seamlessly right after the first one finishes is a pain. (Since they’re separate animations, no matter how precisely you time them, there’s a good chance of some jankiness.)
So I went with option 1: clip paths. At first I thought, “It’s basically the same principle as drawing the chart, just apply it to a clip path, right?” Turns out, this path led straight to hell too.
Can’t Use the circle Element
The road to hell started when I realized I couldn’t use the circle element. Since the animation renders a circle clockwise from a starting point, I naturally assumed circle would work. But on closer thought, the intermediate frames aren’t circles.
The animation only becomes a full circle at the very end. During the animation, the intermediate shapes aren’t circles — so circle can’t be used.
You might ask whether stroke-dasharray and stroke-offset could work, but clippath masks the intersection of filled areas, so stroke-based properties can’t create a mask.

The animation progresses by rendering shapes like these one by one
The intermediate shapes during the animation can’t be defined as circles. A circle is defined as the set of points equidistant from a center, and those partially-eaten shapes don’t satisfy this definition.
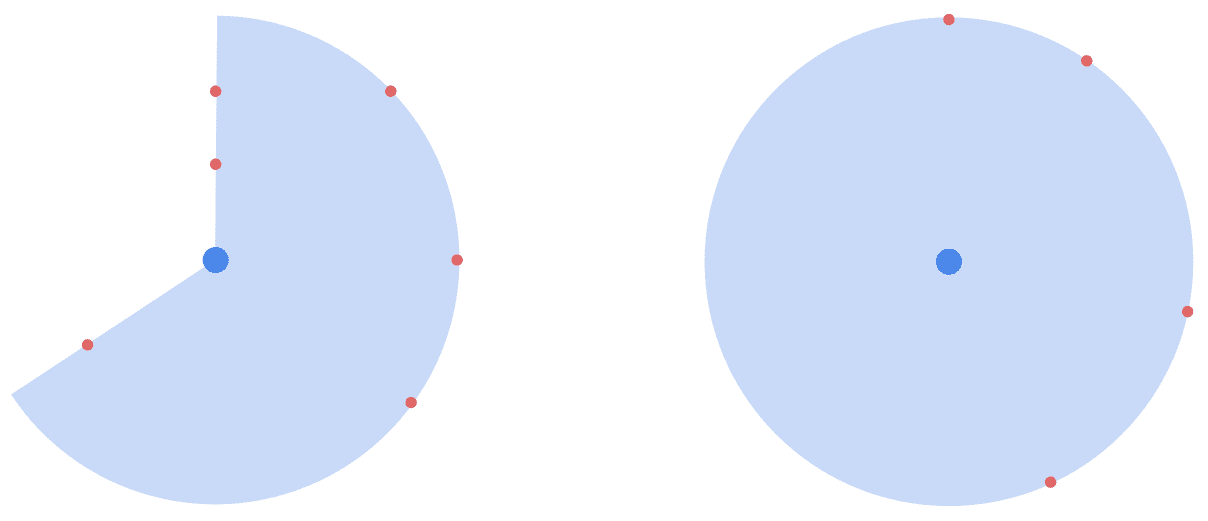
In the figure above, all points on the right shape’s edge are equidistant from the center, but the left shape’s edge points are not. The right shape satisfies the definition of “a set of points equidistant from a center” and is therefore a circle, while the left shape represents a portion of the circumference — an arc.
It’s easy to confuse since we’re drawing arcs based on circles here, but an arc is defined as a portion of the circumference, not a portion of the circle itself. Since ellipses also have circumferences, arcs can take many different shapes.
Since an arc isn’t a circle, the circle element can’t be used for this clip path animation.
Understanding How SVG Renders Arcs
SVG doesn’t provide a dedicated element for arcs, but it offers the A command within the path element to define them.
a rx ry x-axis-rotation large-arc-flag sweep-flag dx dy<path d="
M 50 50
A 45 45, 0, 1, 0, 275 125
L 275 80 Z
"/>This might look simple, but the rendering logic isn’t exactly intuitive. When people see an arc, they naturally think of it as part of a circle and instinctively think in terms of the central angle — but as you can see from the interface above, there’s no angle parameter anywhere.
SVG’s arc rendering does start with defining a circle on the coordinate plane. As discussed, an arc is a portion of a circumference, so you need a circle first.
The circle is defined by the first parameters of the A command: rx and ry. The reason it takes x and y axis lengths instead of a single radius is that arcs are portions of circumferences — not just circles, but potentially ellipses too.
Since a circle is just a special case of an ellipse, the A command is designed with the abstract interface of taking x-axis and y-axis radii. But since all our examples use circles, I’ll keep the explanations circle-based for simplicity.

An important detail: the arc’s starting point is not the circle’s center. Looking back at the path element example, there’s no parameter for the circle’s center point.
<path d="
  M 50 50
  A 45 45, 0, 1, 0, 275 125
  L 275 80 Z
"/>
This command sequence starts with M 50 50, where the M command moves the render cursor to an arbitrary position (Move).
But this position isn’t the circle’s center — it’s the starting point where the arc begins drawing. The arc is drawn from coordinate (50, 50) to the A command’s final arguments (dx, dy), following the virtual circumference defined by rx, ry.
but only the arc's stroke from (x,y) to (dx,dy) is actually rendered
This is the basic principle of how SVG draws arcs. But the catch is that there’s more than one way to connect (x, y) and (dx, dy). An arc simply connects two points along a circumference — there’s no rule saying it has to go in a specific direction.
So SVG uses two circles that can both place (x, y) and (dx, dy) on their circumferences.
 There are exactly two circles that can place both (x, y) and (dx, dy) on their circumference
Using these two circles, there are four possible arcs that connect (x, y) and (dx, dy). The “large arc flag” and “sweep flag” determine which arc gets drawn.
a rx ry x-axis-rotation large-arc-flag sweep-flag dx dyUnderstanding the Arc Flags
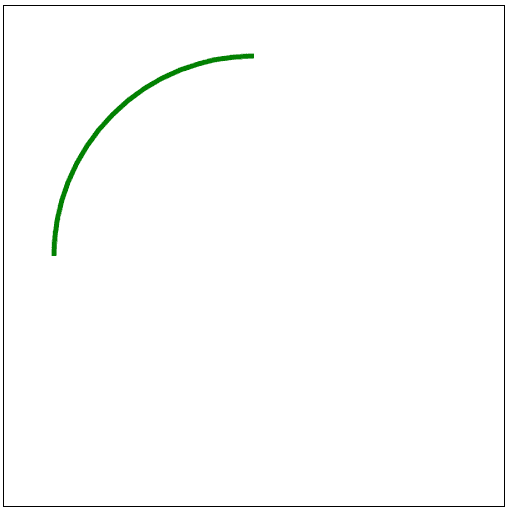
A picture is worth a thousand words, so let’s draw some arcs to understand exactly what these flags do. As with the doughnut chart, I’ll use a 100 × 100 viewbox for easy coordinate reasoning.
<svg width="500" height="500" viewBox="0 0 100 100">
  <path d="
    M 50 10
    A 40 40, 0, 0, 0, 10 50"
    stroke="green"
    fill="transparent" />
</svg>
- Move the render cursor to
(50, 10).- Define a circle with radius 40 by setting both rx and ry to
40.- Set rotation to
0, large arc flag to0, sweep flag to0.- Draw an arc to the endpoint
(10, 50).
With both the large arc flag and sweep flag set to 0, SVG draws the smaller arc by default, in SVG’s default counterclockwise direction.
The rotation parameter determines how much to tilt the reference circle, but since we’re using a circle (not an elongated ellipse), tilting has no effect.
With these commands, we get a nice-looking arc:
The Sweep Flag
There are only two flags for arcs, but the shape changes dramatically when either value flips. This can feel confusing if you don’t understand exactly how SVG draws arcs.
But if you remember that SVG draws lines counterclockwise by default, it’s not that complicated.
Let me redraw the arc from above in more detail:
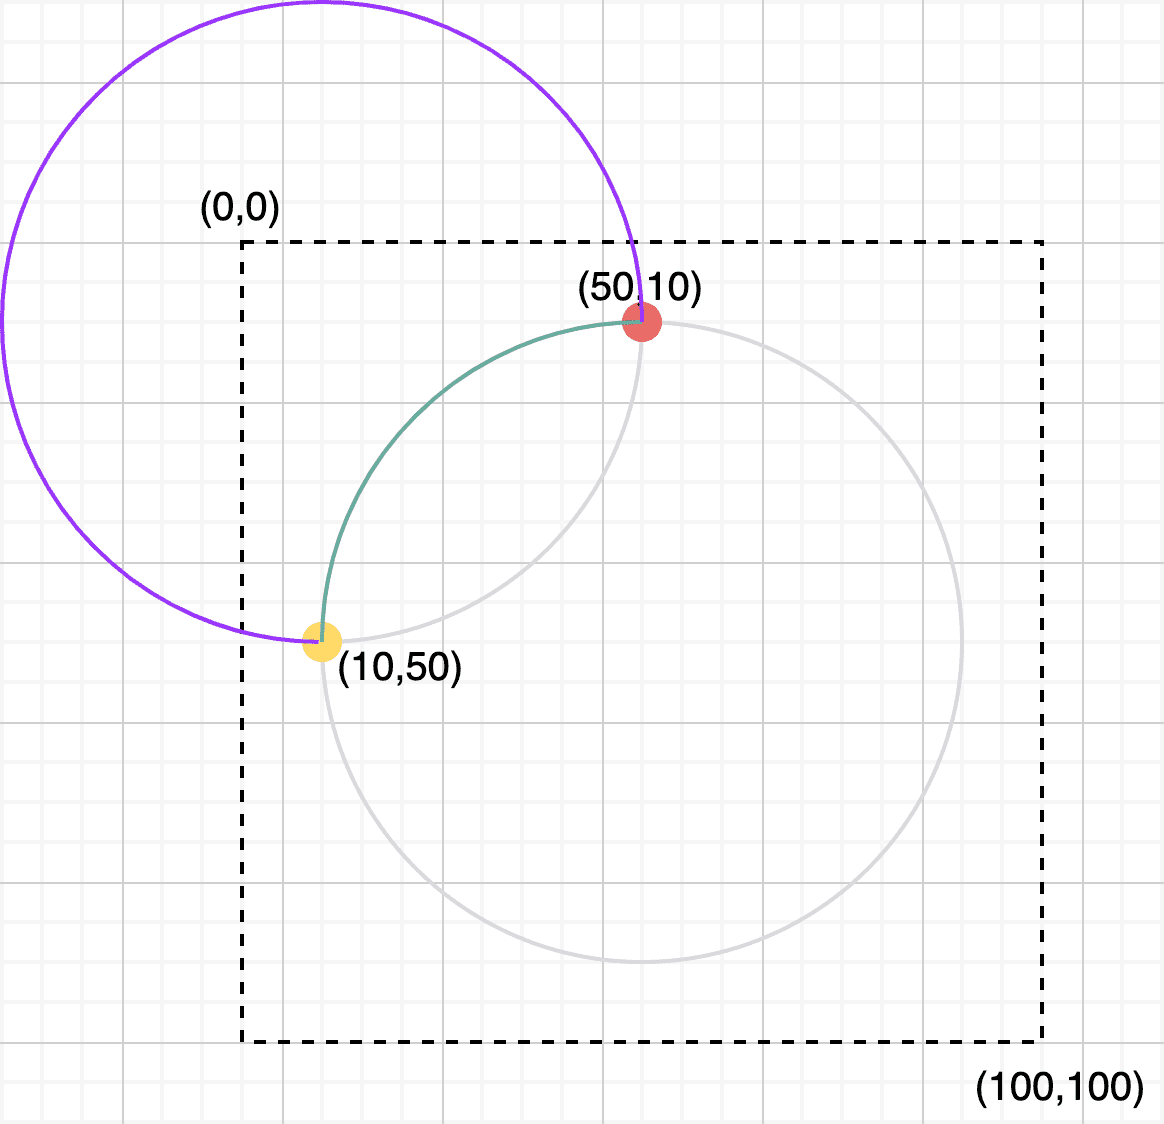
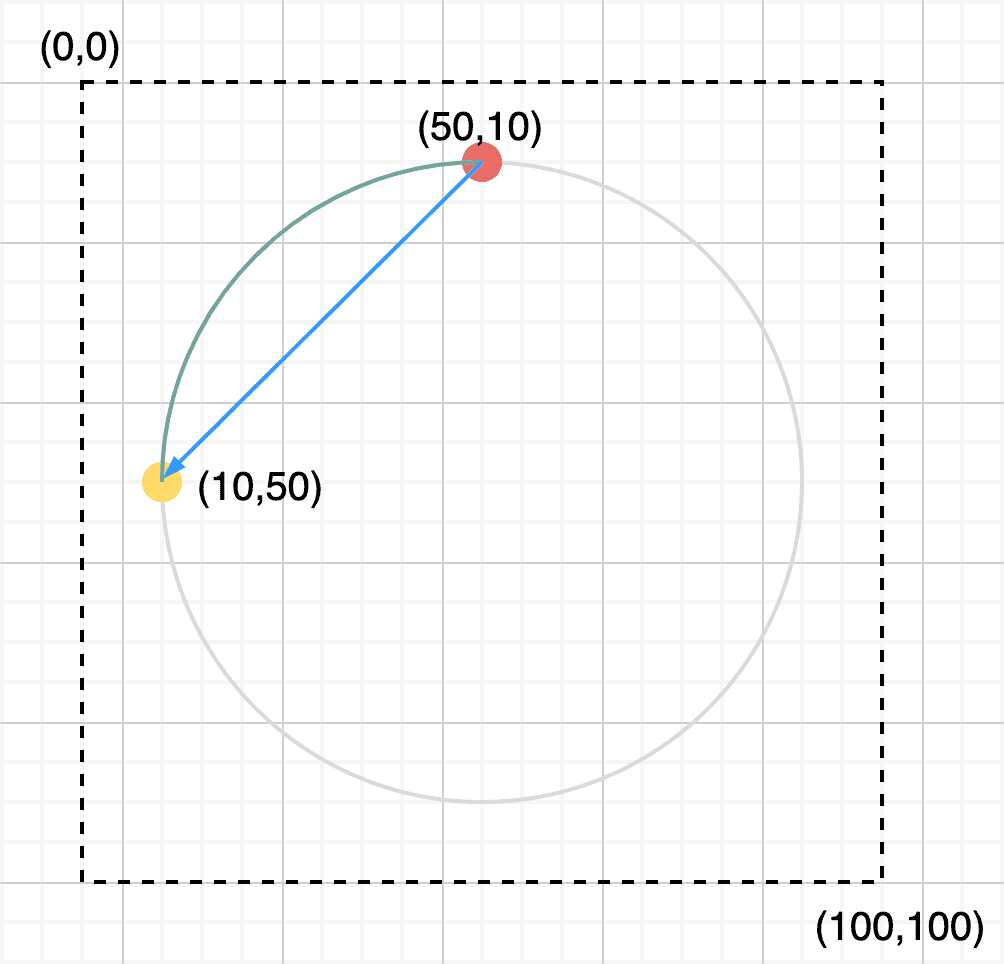 The arc follows the virtual circumference defined by the command
The red dot is the starting point I set with the M command, and the yellow dot is the endpoint (10, 50) from the A command’s last arguments.
The blue arrow shows the actual direction SVG renders the line. There’s only one way to draw a small arc from the start point to the endpoint in the counterclockwise direction. (If this isn’t clear, try drawing it on paper.)
What happens if we swap the start and endpoints? This time, I’ll move the start to (10, 50) and set the endpoint to (50, 10).
<svg width="500" height="500" viewBox="0 0 100 100">
<path d="
M 10 50
A 40 40, 0, 0, 0, 50 10"
stroke="green"
fill="transparent" />
</svg>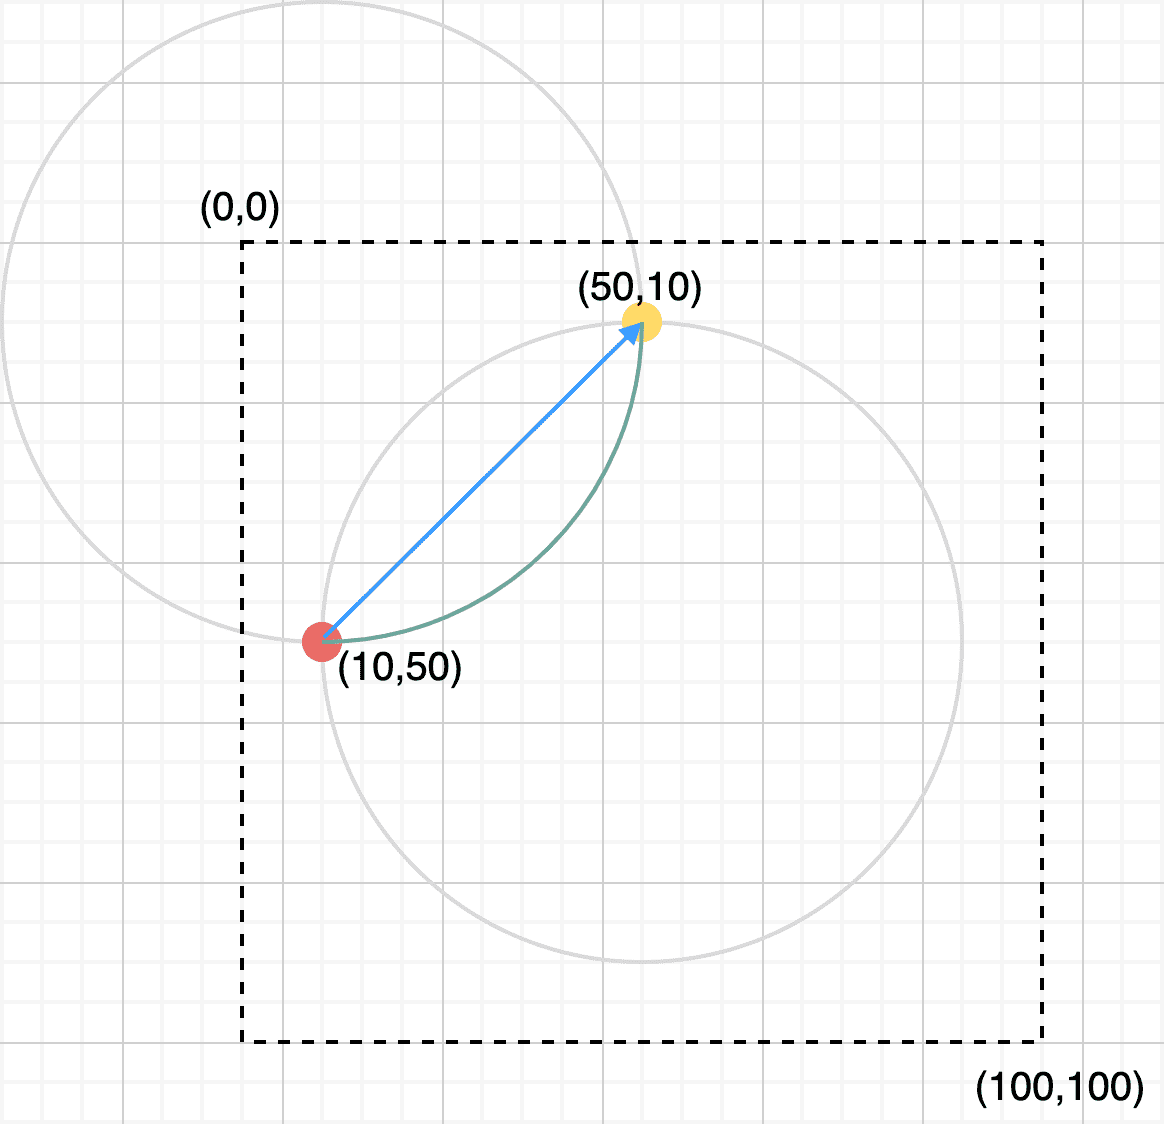 The arc follows a virtual circle on the opposite side
The arc is still drawn along a circle with the same radius, but this time it follows a different virtual circle on the opposite side.
That’s because, just as before, there’s only one way to draw a small arc from this start point to this endpoint in the counterclockwise direction. If you tried to draw an arc along the first example’s circle while connecting these swapped points, it would go clockwise, not counterclockwise.
This is the principle behind the sweep flag. Instead of swapping start and endpoints, you can simply change the drawing direction to define both arcs.
The Large Arc Flag
The large arc flag selects whether to draw the smaller or larger arc connecting the start and endpoints. As we saw, SVG defines two virtual circles for arc rendering, which is what makes the concepts of “small arc” and “large arc” possible.
We’ve already seen the small arc, so let’s see what happens when we draw the large arc.
If the sweep flag is 0 (counterclockwise), the small and large arcs look like this:
 The small and large arcs when the sweep flag is 0
If you draw it out yourself, you’ll easily see that these are the only possible small and large arcs that can connect the start and endpoints counterclockwise on these two virtual circles.
If you set the sweep flag to 1 to switch the drawing direction to clockwise, the arc follows the opposite virtual circle — just as we saw in the sweep flag example.
Finding Arc Endpoints with Trigonometry
Now that we understand how SVG draws arcs, it’s time to build the animation. The animation I wanted sweeps an arc’s central angle from 0° to 360°. So I just need to build it, right?
.
.

All the arc examples I used above had central angles of 90° or 270°. There’s a reason for that.
Arcs are defined by specifying a start point and an endpoint. To draw an arc neatly along a circumference, both points must lie on that circumference. But when the angle is 90°, 180°, or 270°, you can simply pick points on the X and Y axes without any calculation — which is why all my examples conveniently used those angles.
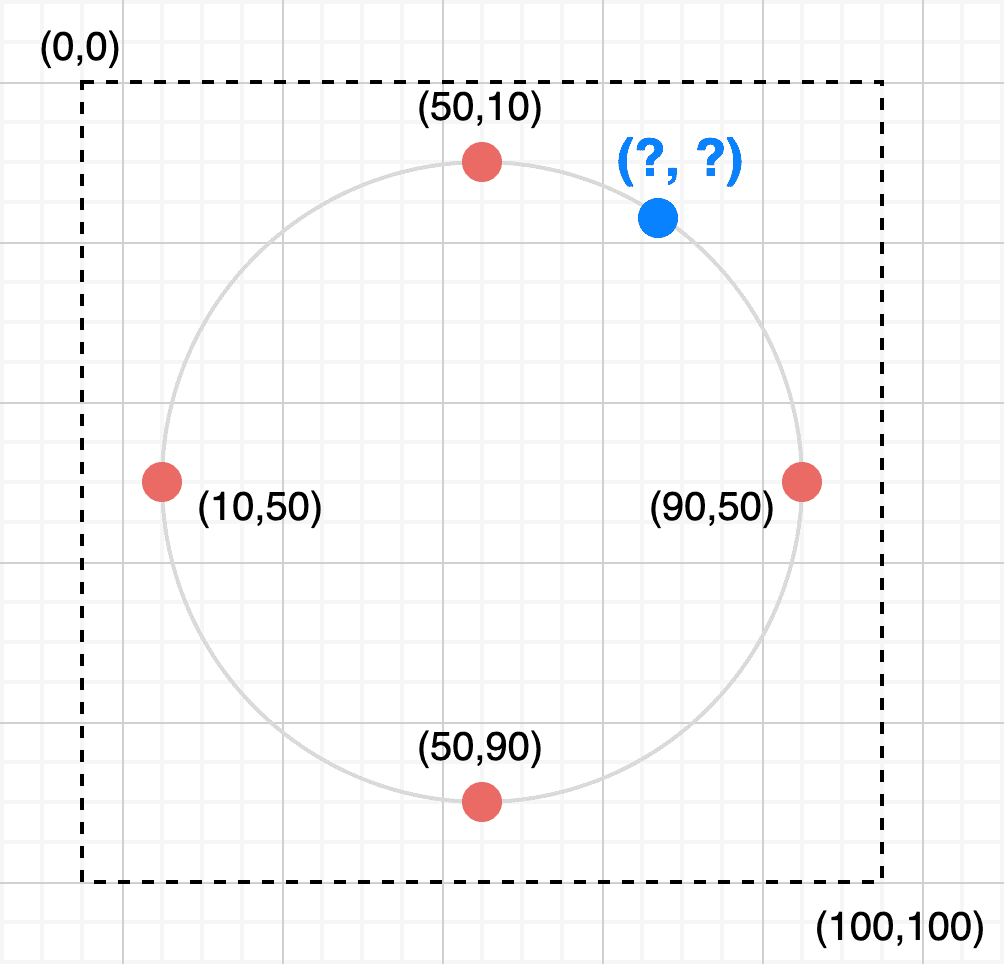 The red points on the circumference are easy to compute mentally,
but the blue points are not...
But the clip path animation doesn’t teleport between 90°, 180°, 270°, and 360° — it moves smoothly. So I need to find the coordinates of countless blue points along the circumference as the animation progresses. How?
The answer is trigonometry.
Save Me, Trigonometry!
As I mentioned, the most intuitive unit for thinking about arcs is degrees. So I envisioned a nice interface like this:
interface ArcData {
x: number; // x-coordinate of the circle's center
y: number; // y-coordinate of the circle's center
radius: number; // Circle radius
degree: number; // Angle to draw the arc from the origin
}
const drawArc = ({ x, y, radius, degree }: ArcData) => {
return `M blah A blah L Z`; // Arc drawing commands, roughly
};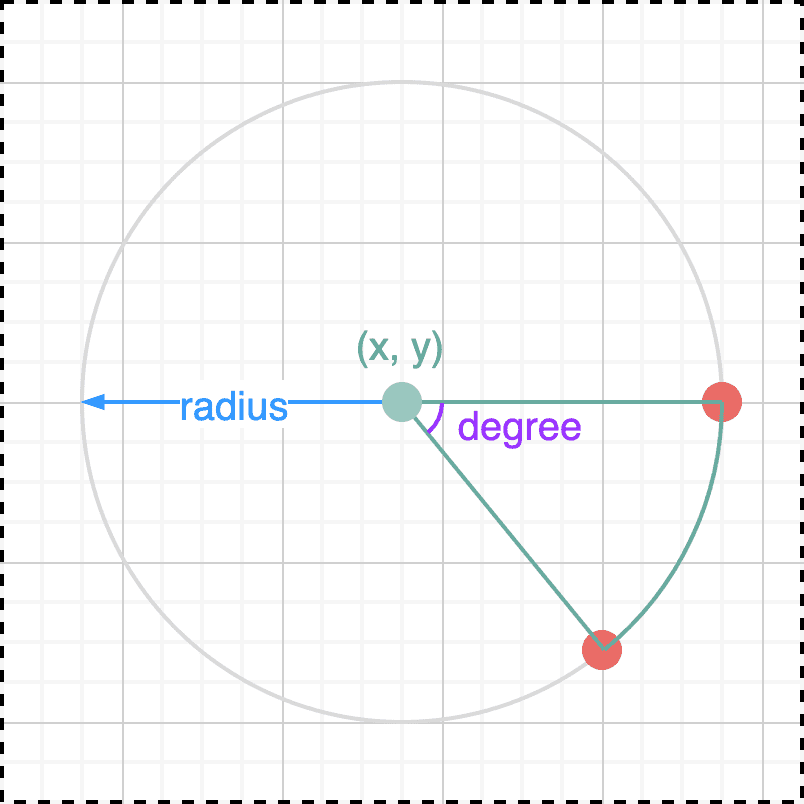 The product of happy-path thinking
To draw an arc using an arbitrary angle as I designed, I need to pick an arbitrary start point and then use the angle to compute the endpoint’s coordinates.
The start point can be any point on the circumference. As I mentioned, SVG uses (cx + r, cy) as the starting point when rendering circles, so I’ll use this same coordinate as the 0° reference.
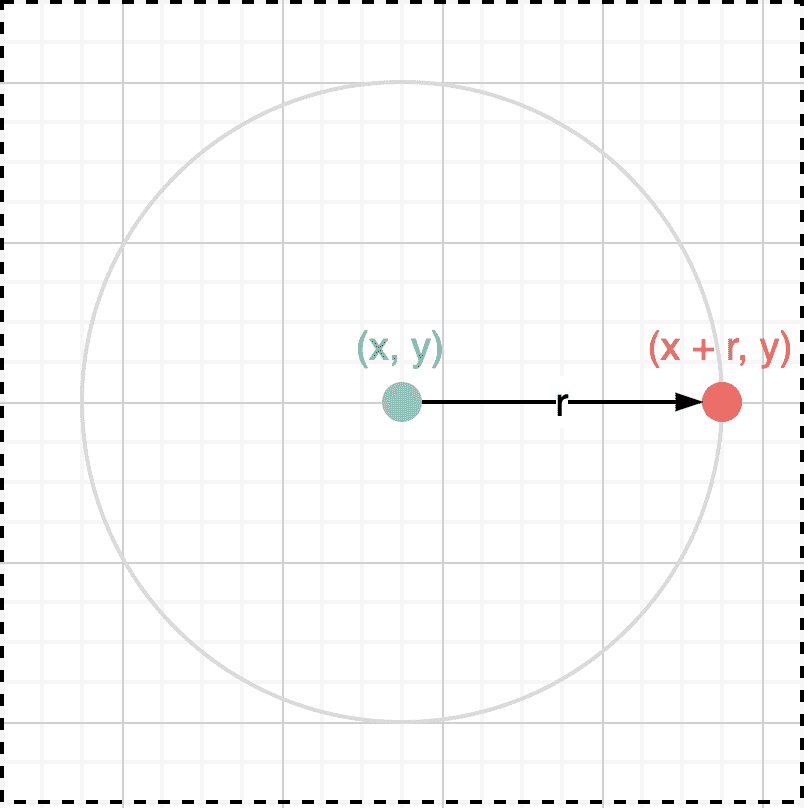 Connecting the circle's center to this point creates the initial side at 0°
With the initial side defined, I just need to find which point on the circumference lies at angle from it.
This is where trigonometry comes in. Using trig functions, we can easily find the coordinates where a line at a given angle from the initial side intersects the circumference. Let’s dust off the trigonometry we learned in school.
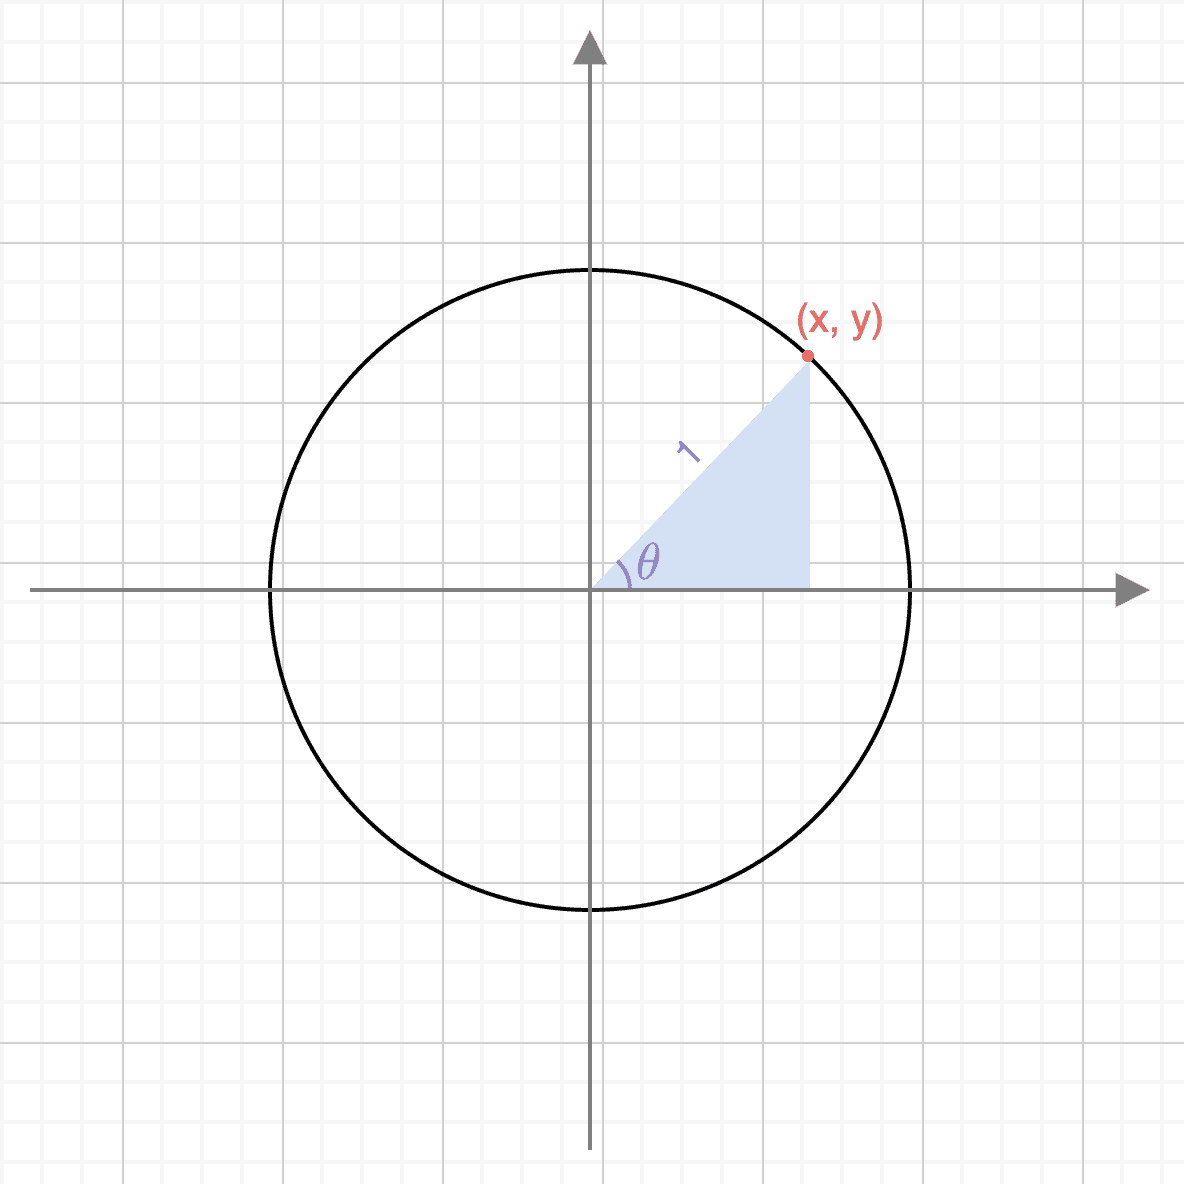
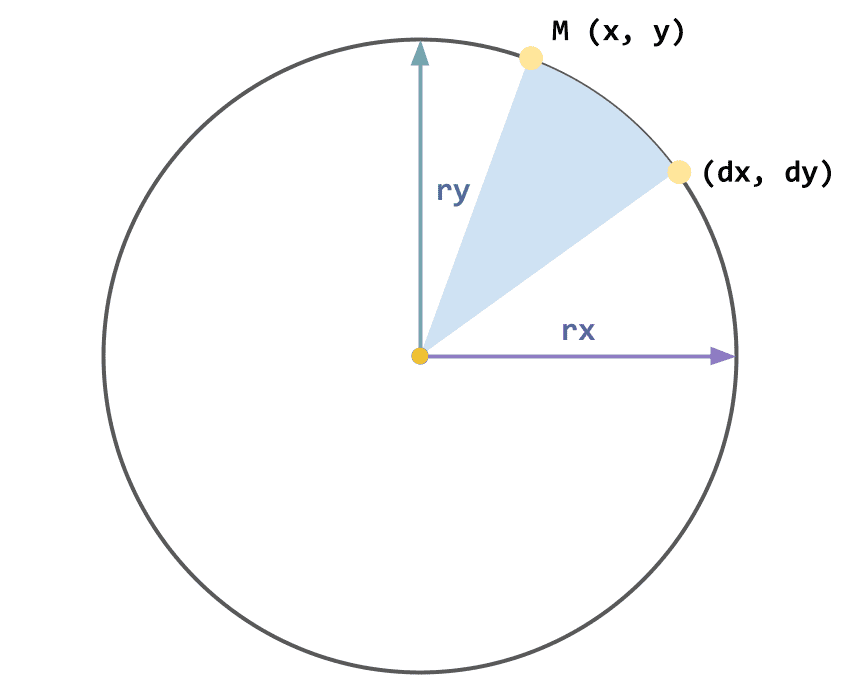
This shows a circle with radius 1 on a coordinate plane. The -axis serves as the initial side, and we measure angle counterclockwise from it.
The point (x, y) where the line at this angle meets the circumference is exactly what we want to find. Drawing a perpendicular line from this point down to the initial side creates a right triangle.
Using trigonometric functions on this triangle, we can define the components x and y of point (x, y):
This is high school material, but it had been so long that I had to look it up too. (The memories of SOH-CAH-TOA came flooding back…)
If this were a math exam, you’d need to solve it by hand using the angle and trig ratios. But thankfully, JavaScript provides Math.sin and Math.cos, so we don’t have to compute them ourselves.
One thing to be careful about, though, is the unit of angle . When we think of angles, we naturally think in degrees like . But a value with the special unit “degrees” can’t be computed with regular numbers — you can’t use degrees directly with trig functions.
If that’s not clear, think about it this way: adding 10km and 6 doesn’t give you 16km. Similarly, 10km plus 6 miles isn’t 16km either. To perform arithmetic on physical quantities, both operands must have the same unit.
Since trig functions are functions operating on numbers, they can’t work with values that carry a special unit. 90 is just 90, but “90 degrees” can’t be fed into a trig function. So we need to convert degrees to radians — a unit-free measure of angle.
Radians might sound intimidating, but it’s just a different way of expressing the same thing: “let’s call 180° ’ radians.‘” It’s like converting 1 Korean geun to 600 grams.
Radians, like degrees, are a way of expressing angles. But since radians are defined using arc length and radius, they’re expressed as pure, unit-free numbers.
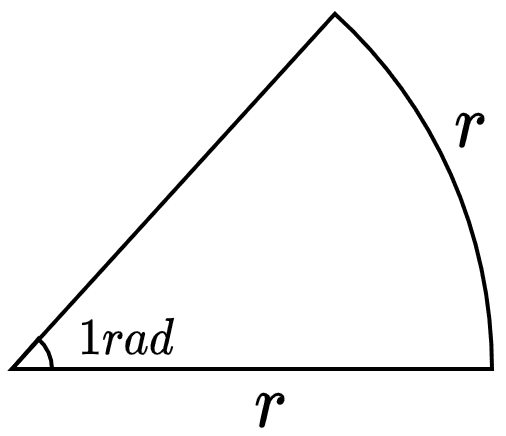
Knowing that 1 radian is the central angle where the arc length equals the radius makes everything else easier.
We already know the full circumference is . So how many arcs with a central angle of 1 radian do you need to complete a full circle?
Exactly of them. In other words, a full 360° equals radians.
Since an arc with a 1-radian central angle always has a length of (the radius), you need such arcs to cover the entire circumference, giving a total arc length of and a central angle of radians.
From here, you can easily infer that half a circle needs arcs. A semicircle with a 180° central angle corresponds to radians.
So what about 90°? That’s half of 180°, so it’s radians. Generalizing this:
This formula is simple enough to be a one-liner in code:
const degree = 90;
const radian = (degree / 180) * Math.PI;
Since radians express angle magnitude using only arc length and radius with no units attached, we can freely compute with other numbers. Using radians and trig functions, we can find the coordinates of any point on the circumference at any angle from the initial side.
Putting all this together, we can write a function that generates the path element commands for drawing an arc:
// Values needed to draw an arc
interface ArcData {
  x: number;
  y: number;
  radius: number;
  degree: number;
}
// Find the coordinates of a point at n degrees from the initial side using trig
const getCoordsOnCircle = ({ x, y, radius, degree }: ArcData) => {
const radian = (degree / 180) * Math.PI;
return {
x: x + radius * Math.cos(radian),
y: y + radius * Math.sin(radian),
};
};const MAX_DEGREE = 359.9;
// Draw an arc of degree(θ) in the positive direction centered at (x, y)
export const getArc = (props: ArcData) => {
const startCoord = getCoordsOnCircle({ ...props, degree: 0 });
const finishCoord = getCoordsOnCircle({ ...props });
const { x, y, radius, degree } = props;
const isLargeArc = degree > 180 ? 1 : 0;
const isEnd = degree === MAX_DEGREE;
const d = `M ${startCoord.x} ${startCoord.y} A ${radius} ${radius} 0 ${isLargeArc} 1 ${finishCoord.x} ${
finishCoord.y
} L ${x} ${y} ${isEnd ? 'z' : ''}`;
return d;
};By passing values from 0 to 359.9 sequentially to the getArc function’s degree parameter, we can render all the arcs needed for the animation. (I used react-spring for the implementation.)
Note that the maximum angle is 359.9, not 360. When the central angle reaches 360°, the start and endpoints have the same coordinates, causing SVG to render nothing. So I cap it at 359.9 and, when that value is reached, use the Z command to draw a line straight back to the start point.
Of course, the closer the max value is to 360°, the more circle-like the arc becomes. But at a certain point, the difference is imperceptible to the human eye, so this was good enough.
Wrapping Up
You don’t have to build a doughnut chart from scratch like I did — you could just use an existing chart library and call it a day. But since all I needed was a bar chart and a doughnut chart, I decided that bundling a heavy chart library just for these two wasn’t worth the trade-off. (Admittedly, it took more time than expected.)
Every now and then, working with 2D or 3D graphics requires mathematical concepts like trigonometry or linear algebra. Some people see math-heavy examples and think, “I’m bad at math, I can’t do this.” But I’m far from being good at math myself.
When I took my college entrance exam, I didn’t study math at all — I just filled in the same answer for every question on the answer sheet and fell asleep, earning a rank of 8 out of 9. The only people below me were probably others who did the exact same thing. If someone who completely gave up on studying math can understand this stuff, then most people can too with just a bit of thought.
Sure, if you try to go deep into the theories and formulas, it’s endless and genuinely hard. In fact, you probably won’t understand most of it anyway. But the level of math needed to solve the kinds of problems we encounter when building real applications isn’t that difficult.
Back in school, they taught trigonometry without ever explaining what real problems it could solve — they just made us memorize formulas for exams. (Even though I slept through every class, SOH-CAH-TOA somehow stuck…)
But things are different now. We know exactly what problems these formulas can solve, and the person experiencing the problem is us. That makes the motivation far stronger than when we were studying purely for exams.
That’s all for this post on how SVG doughnut charts work — a trigonometric approach.