Fixing Webpack Watch Memory Leak
How to track memory leaks – Using Chrome DevTools and Heap Snapshots

In this post, I want to briefly document a Webpack Watch feature memory leak I recently fixed. As the project I developed at work grew, running builds multiple times during Watch eventually caused out of memory errors killing the process. This problem actually occurred quite a while ago but kept being ignored while developing business issues - I happened to get a chance to look into this issue closely.
Actually, just Googling webpack watch memory leak shows many comrades worldwide suffering from the same issue.
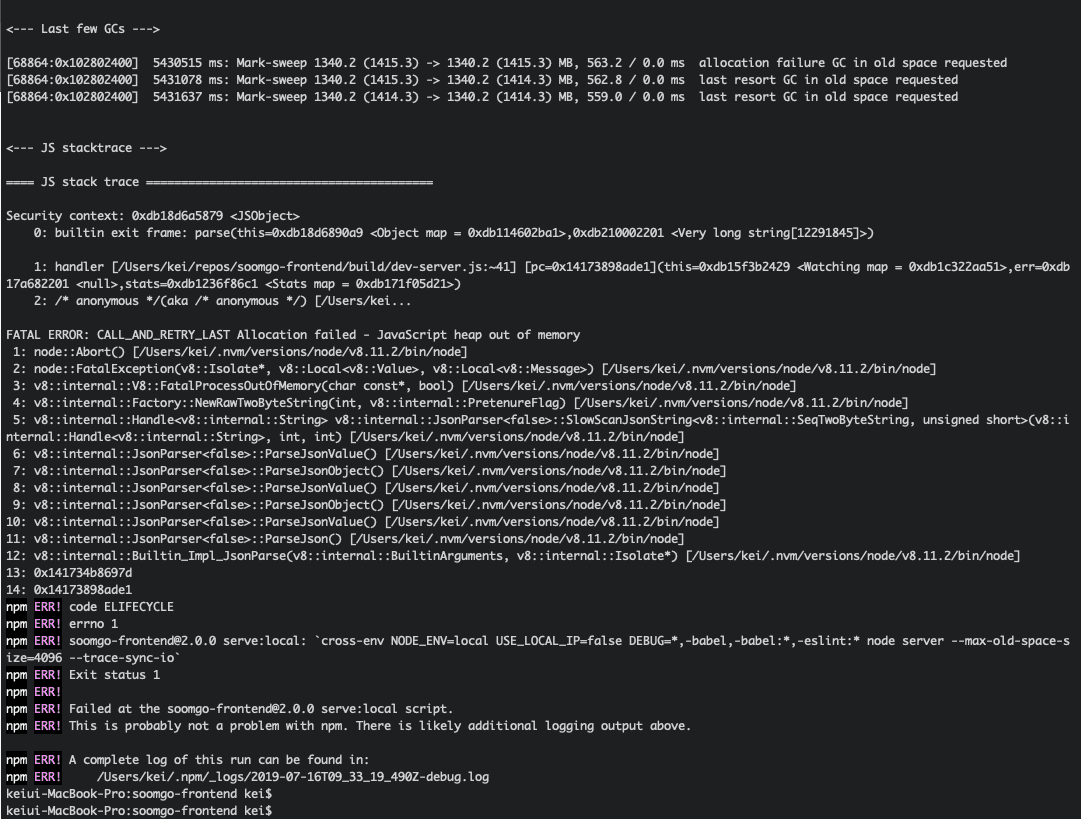 Sad screen you can often see when using Webpack
First, this problem’s most famous solution is using NodeJS’s --max-old-space-size to increase Old Space area. Originally Old Space’s default size is about 1.4GB for 64-bit, but many solutions recommend allocating 4GB or 8GB to Old Space when memory explodes like this.
Actually using this method solves it reasonably well. Memory leaks generally occur when garbage that should be collected during GC (garbage collecting) doesn’t get properly collected - uncollected garbage objects all stay in Old Space. But this method isn’t a fundamental solution - it just delays when memory explodes.
Allocated 4GB to Old Space and after 20 builds memory exploded so allocated 8GB to Old Space? Even so, it’ll explode again after about 40 builds eventually.
That doesn’t mean solving it this way is wrong. I actually was already allocating about 4GB to Old Space through the --max-old-space-size=4096 option. But this feels like, what should I say, painkillers rather than fundamental treatment, so I wanted to find this issue’s cause and properly fix it this time.
Using NodeJS Inspector
First, why such memory leaks are tricky to fix is because tracing the cause is difficult. For example, TypeError logs very clearly tell you where and why a type error occurred, but memory leaks don’t have that.
They just seem to execute smoothly then suddenly die with out of memory at some moment. The program does squeeze out last strength to leave a few lines of stack trace when dying, but since it feels like showing only superficial causes, it didn’t help much when fixing memory leaks.
So when fixing such memory leaks, you must first tear into JavaScript’s heap. Identifying what’s gradually eating memory within the program. When running NodeJS with some options, you can use Google Chrome’s developer tools to take heap snapshots.
$ node --inspect --inspect-brk server
After starting the application with the --inspect option and selecting any Google Chrome window then opening developer tools, you can see a NodeJS icon appeared in the left corner. Clicking that icon shows a new inspector that can profile NodeJS. And the --inspect-brk option stops execution using the Debug Pause function before executing code. Code executes when developers directly press the Resume button.
Memory Leak Cause
What I first did was also taking heap snapshots using NodeJS’s inspector. Actually, I thought this issue was slightly different from typical memory leak situations - typical memory leaks generally follow this scenario:
- Create object!
- Release object reference!
- But no GC…? What…?
- Turns out another guy was referencing it
So typical memory leaks often start with “what’s referencing the object that should be released?” So usually you allocate an object and take one heap snapshot, release the object reference and take another heap snapshot, then debug by comparing those two snapshots. I definitely released the reference but something still seems maintained? That’s probably the culprit. Finding this culprit is insanely difficult though…
But Webpack’s memory leak issue didn’t seem like such complex issues. Looking at others’ cases on Stack Overflow, many said no problems when projects were small but such problems occurred as projects grew, and I was in that situation too, so from the start I set the direction as the hypothesis “are files continuously accumulating with each build?”
So to verify the hypothesis, I first proceeded with builds, then took heap snapshots every build to observe memory usage changes, and as a result discovered that something called Memory File System was gradually growing.
| Build Count | MFS Memory Usage (bytes) |
|---|---|
| 1 | 21,034,701 |
| 2 | 38,776,735 |
| 3 | 45,209,592 |
| 4 | 51,642,543 |
| 7 | 83,807,008 |
| 10 | 122,404,490 |
| 13 | 180,301,478 |
After checking this far and cracking open the Memory File System object’s interior, as expected I could confirm all bundled files kept accumulating.
 Disgusting things...
Why did this problem occur? The reason was that project’s Webpack settings had bundle file name pattern as client-bundle.[chunkhash].js. The chunkhash or hash option creates new filenames with every bundling, freeing you from file caching issues occurring in production. But in development environment, this option became poison instead.
When Webpack starts the dev server, it stores bundled files using a library called memory-fs. This library just internally has a map, and file contents are arrays having each line of the file as elements. In other words, if the bundled file name is main.js, an object with the following structure gets created:
const MFS = {
  'main.js': ['var a = 1', 'console.log(a)']
}
If I modify the main.js file or modules dependent from it, main.js will be rebundled and change the MFS object’s main.js key value to the newly bundled file’s contents. However, problems occur when filenames change with each build like chunkhash or hash.
const MFS = {
  'main.1111.js': ['var a = 1'], // Previous file
  'main.2222.js': ['var a = 2'] // Newly bundled file
}
main.1111.js is the bundle created in the previous build and main.2222.js is the bundle created in this build. chunkhash, hash change hash values when rebundling files, so bundled file names differ, and consequently previous version bundles stored in the MFS object remain without being replaced. In other words, files accumulate.
This object itself, arrays containing file lines, and strings having lines’ values all naturally get stored in memory, and since memory-fs keeps referencing these guys, consequently even after moving to Old Space they kept not being collected by GC.
Solution
Actually when first encountering this problem, I thought of about 3 solution methods.
- Don’t use
hashorchunkhashin filename pattern in development environment.- Directly remove previous build’s bundle in Webpack’s compiler hook (method
HotModuleReplacementuses)- Just increase Old Space. (Final method abandoning pride)
Actually method 1 of removing chunkhash from filename pattern alone solves the problem, but just in case I thought of the next alternative. I usually don’t expect one-shot solutions when meeting such problems. (Falling from high places hurts more. Let’s not expect at all)
But fortunately solution method 1 solved it in one shot.
// webpack.client.config.js
// ...
const isLocal = process.env.NODE_ENV === 'local';
// ...

module.exports = {
  output: {
    filename: isLocal ? 'client-bundle.[name].js' : 'client-bundle.[chunkhash].js',
  },
}
Built at: 2019-08-06 10:29:34
Asset Size Chunks Chunk Names
client-bundle.app.js 4.16 MiB app [emitted] app
client-bundle.app.js.map 2.98 MiB app [emitted] app
client-bundle.chat.js 815 KiB chat [emitted] chat
client-bundle.chat.js.map 503 KiB chat [emitted] chat
client-bundle.chat~user.js 312 KiB chat~user [emitted] chat~user
client-bundle.chat~user.js.map 200 KiB chat~user [emitted] chat~user
client-bundle.polyfill.js 6.24 KiB polyfill [emitted] polyfill
client-bundle.polyfill.js.map 6.23 KiB polyfill [emitted] polyfill
client-bundle.search.js 254 KiB search [emitted] search
client-bundle.search.js.map 224 KiB search [emitted] search
client-bundle.style-guide.js 135 KiB style-guide [emitted] style-guide
client-bundle.style-guide.js.map 105 KiB style-guide [emitted] style-guide
client-bundle.user.js 134 KiB user [emitted] user
client-bundle.user.js.map 70.2 KiB user [emitted] user
client-bundle.vendor.js 4.6 MiB vendor [emitted] vendor
client-bundle.vendor.js.map 5.25 MiB vendor [emitted] vendor
fontawesome-webfont.eot?674f50d287a8c48dc19ba404d20fe713 162 KiB [emitted]
fontawesome-webfont.ttf?b06871f281fee6b241d60582ae9369b9 162 KiB [emitted]
fontawesome-webfont.woff2?af7ae505a9eed503f8b8e6982036873e 75.4 KiB [emitted]
fontawesome-webfont.woff?fee66e712a8a08eef5805a46892932ad 95.7 KiB [emitted]
index.html 804 bytes [emitted]
sw.js 4.79 KiB [emitted]
sw.js.map 4.2 KiB [emitted]
vue-ssr-client-manifest.json 108 KiB [emitted]Since I removed chunkhash from the filename pattern and added name, bundles will now always be created with the same name like client-bundle.app.js no matter how many builds. And as mentioned above, since memory-fs uses filenames as map keys, when storing new files to the map, previous build bundles with the same name will automatically get overwritten.
Below is the size of the dist object within Memory File System analyzed using heap snapshots after performing this work.
| Build Count | MFS Memory Usage (bytes) |
|---|---|
| 1 | 21,031,408 |
| 2 | 21,023,274 |
| 3 | 21,023,224 |
| 4 | 21,023,310 |
Now even doing multiple builds, memory used by memory-fs no longer gradually increases, and frontend chapter developers can finally continue developing in a comfortable environment!
Wrapping Up
Actually this issue was a case that could be quickly solved because the hypothesis set when first encountering the issue fit exactly. But proving that hypothesis took almost all day - the reason being Google Chrome inspector takes too long to take heap snapshots once. Like seriously almost 3-4 minutes per snapshot…
After identifying the cause and proving the hypothesis, the solution was extremely simple - kind of felt like blowing your nose without using hands…? Well anyway, I was fortunate to solve it easily.
That’s all for this post on fixing Webpack Watch memory leak.
관련 포스팅 보러가기
How Does the V8 Engine Execute My Code?
Programming/JavaScript[JS Prototypes] Implementing Inheritance with Prototypes
Programming/JavaScriptBeyond Classes: A Complete Guide to JavaScript Prototypes
Programming/JavaScriptHeaps: Finding Min and Max Values Fast
Programming/Algorithm[Making JavaScript Audio Effectors] Creating Your Own Sound with Audio Effectors
Programming/Audio